
- The daily chart reveals slightly bullish momentum with the RSI at 52, indicating durable buying traction.
- Indicators on the hourly chart indicate a slight downtrend that could indicate a potential move.
- Buyers must successfully maintain the major SMA to mitigate bearish threats and ensure bullish continuation.
The EUR/JPY pair is currently trading at 163.13 and showing minimal losses. Despite the declines, broader momentum remains bullish, but this sentiment remains finely balanced and open to swings.
Daily diagram, the EUR/JPY pair is indicating signs of relatively positive to neutral momentum. The Relative Strength Index (RSI) has been moving in positive territory during recent sessions, with the last value placed at 52. This value suggests a slightly bullish momentum, but potentially susceptible to changes in market sentiment. Meanwhile, the red bar on the Moving Average Convergence Divergence (MACD) histogram indicates negative momentum, signaling that sellers may be preparing.
Daily chart of EUR/JPY
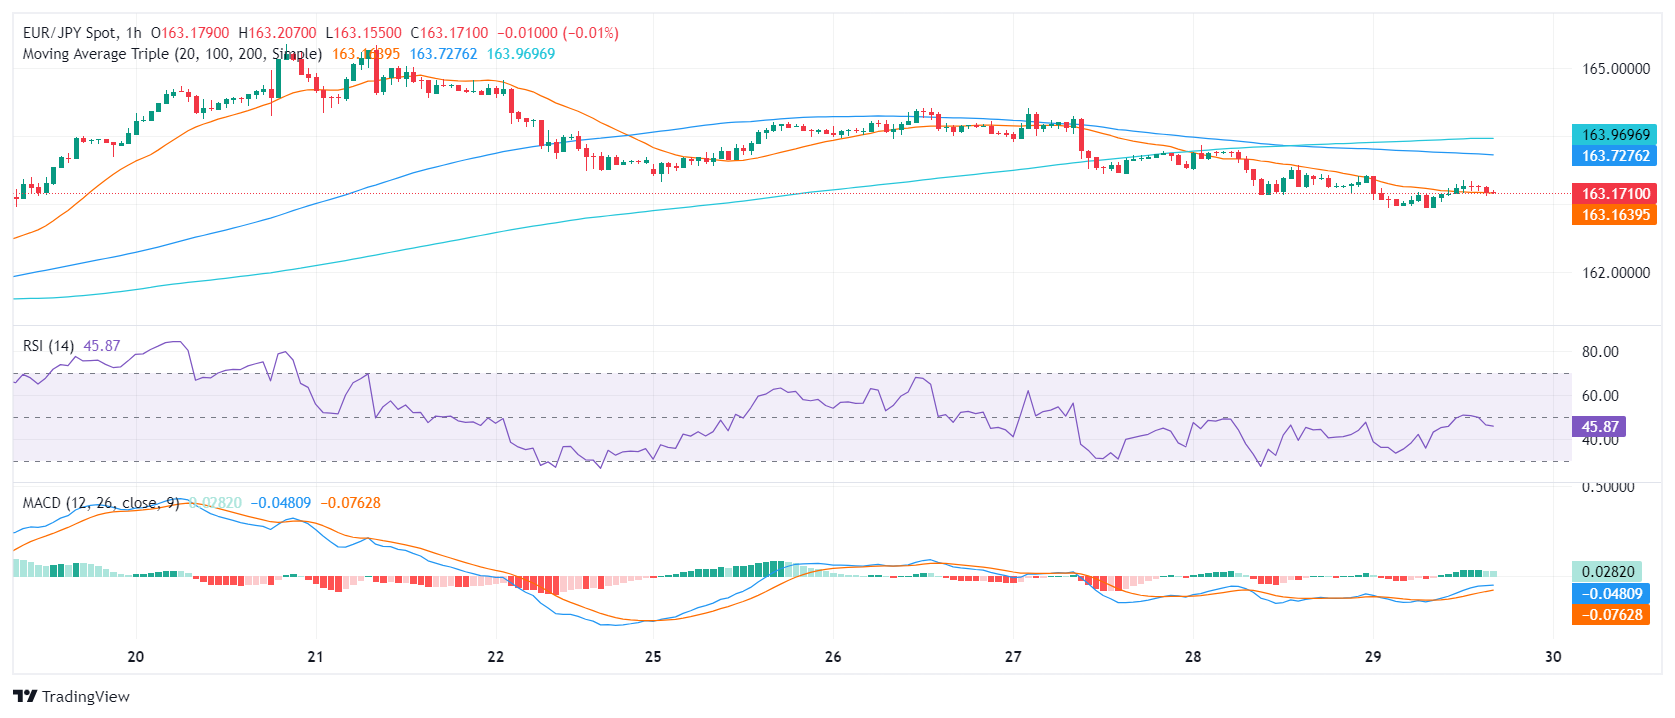
Shifting the focus to the hourly chart makes the swings more noticeable. The RSI readings show a slight downward trend in the last hours, reaching as high as 46. Furthermore, the persistently falling green MACD bars confirm the overall bearish momentum.
EUR/JPY hourly chart
In conclusion, while the short-term indicators may show an inclination towards a seller's market, it is important to remember that this is in a broader bullish context as seen on the daily chart. Buyers need to step in and defend the 20-day SMA at 162.85 to keep the overall bullish trend intact.